North & Central America · Beach travel
Best time to visit Los Cabos
Mid Nov–Mid Jun is the best time to visit. During this period, the average daytime high is 26.6°C, with 0.3 rainy days per 10 days.
View on the globe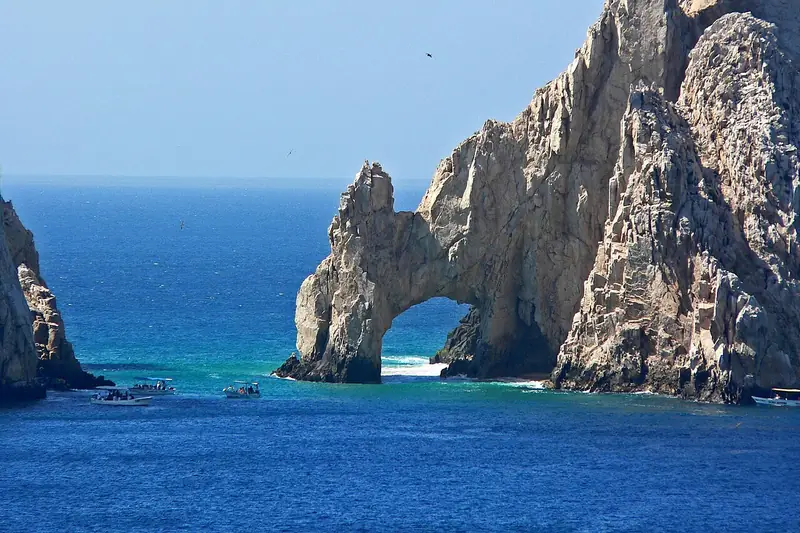
Season calendar
AvoidOff-seasonFairOkayGoodGreatBest
Japan MOFA travel advice
Japan MOFA travel advice: Level 1 (Exercise caution)
Climate and season score by month
| Month | Level | Daytime high | Rainy days (per 10 days) | Cloud cover |
|---|---|---|---|---|
| January | Best | 25.2°C | 0.4 | 42.1% |
| February | Best | 25.1°C | 0.4 | 38.7% |
| March | Best | 25.9°C | 0.1 | 33.6% |
| April | Best | 26.7°C | 0.1 | 38.1% |
| May | Best | 28.0°C | 0.1 | 29.8% |
| June | Best | 29.3°C | 0.3 | 32.8% |
| July | Good | 31.2°C | 1.0 | 45.6% |
| August | Fair | 31.7°C | 2.8 | 51.7% |
| September | Avoid | 31.0°C | 3.4 | 49.3% |
| October | Good | 30.9°C | 1.1 | 31.9% |
| November | Best | 28.7°C | 0.4 | 36.3% |
| December | Best | 26.1°C | 0.4 | 45.5% |
How the score works
The season score is a relative 0–100 measure of how suitable each time of year is for travel at this destination, grouped into seven levels. It combines climate-normal trends in temperature, rain, cloud cover, and other conditions.
Data: NASA POWER, NOAA GHCN-Daily, OISST, IBTrACS, and Natural Earth.
These are historical climate-normal trends, not a weather forecast.